Code
import math
import numpy as np
import matplotlib.pyplot as pltThis post walks through a simple, reproducible workflow for generating publication-quality figures using Matplotlib.
One of the most common (and honestly most distracting) issues I run into when reading papers is poorly formatted figures: tiny fonts, stretched labels, and inconsistent styling.
In my experience, the root cause usually comes down to two things:
Figures are created with the wrong size and then resized later
Fonts aren’t rendered properly in the first place
Both issues are completely avoidable, yet they are still very common in many publications. In this post, I’ll show a Docker-based approach that takes care of the annoying setup details and dependencies, so you can render figures with proper LaTeX fonts and correct sizing. If you care about clean, professional-looking plots, this workflow will save you a lot of frustration.
First, figure out how much space your figure actually gets in the paper. Guessing here is how you end up with tiny fonts or awkward rescaling later.
If you want the exact column width of your LaTeX template (down to the point), temporarily drop this into your document and compile:
The column width is: \the\columnwidthThis will print something like 252.0pt directly into the PDF.
Divide by 72.27 to convert points to inches (TeX uses 72.27 points = 1 inch).
Matplotlib’s native unit for figure size is inches, so you can directly map this value to:
figure.figsize = (width_in, height_in)Width
Height:
If you’re writing your paper in LaTeX, the most consistent way to match fonts is:
text.usetex: Truetext.latex.preamble: your venue-specific preambleGood defaults:
Below are two example preambles (ACM vs IEEE-style). Pick one.
import math
import numpy as np
import matplotlib.pyplot as plt# Target figure size (inches)
fig_width = 3.34
fig_height = fig_width * (math.sqrt(5) - 1.0) / 2.0 # golden ratio
font_size = 10
legend_font_size = 7
ACM_PREAMBLE = [
r"\usepackage[T1]{fontenc}",
r"\usepackage[tt=false,type1=true]{libertine}",
r"\usepackage[varqu]{zi4}",
r"\usepackage[libertine]{newtxmath}",
r"\usepackage{amsmath}",
r"\usepackage{siunitx}",
]
IEEE_PREAMBLE = [
r"\usepackage[T1]{fontenc}",
r"\usepackage{mathptmx}",
r"\usepackage{amsmath}",
r"\usepackage{siunitx}",
]
params = {
"axes.labelsize": font_size,
"axes.titlesize": font_size,
"axes.linewidth": 1.0,
"font.size": font_size,
"legend.fontsize": legend_font_size,
"xtick.labelsize": font_size,
"ytick.labelsize": font_size,
"figure.figsize": [fig_width, fig_height],
"lines.linewidth": 1.0,
"pdf.fonttype": 42,
"ps.fonttype": 42,
"text.usetex": True,
# Choose ONE style:
"text.latex.preamble": "\n".join(ACM_PREAMBLE),
# "text.latex.preamble": "\n".join(IEEE_PREAMBLE),
}
plt.rcParams.update(params)For publications, prefer PDF for LaTeX workflows.
x = np.linspace(0, 10, 400)

fig, ax = plt.subplots()
ax.plot(x, np.sin(x), label=r"$\sin(x)$")
ax.set_xlabel(r"$x$")
ax.set_ylabel(r"$y$")
ax.legend(frameon=False)

# Adjust layout manually
fig.subplots_adjust(left=0.17, bottom=0.2, right=0.98, top=0.98)

# Save
fig.savefig("fig.pdf")

plt.show()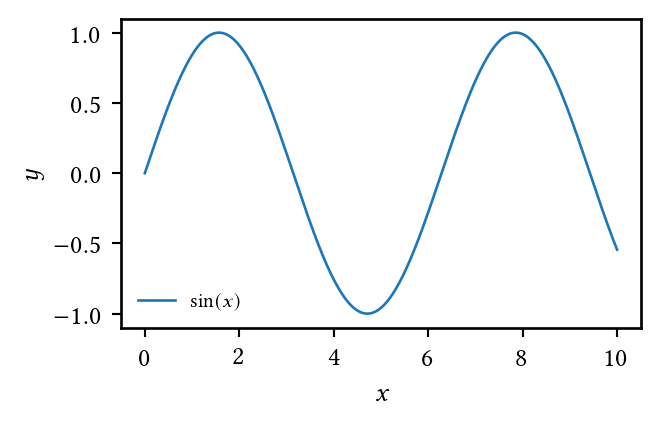
bbox_inches="tight" for paper figures. It recalculates the bounding box to fit all elements (labels, titles, legends) tightly, often resulting in a different-sized image than expected!fig.subplots_adjust(...) to control margins explicitly and keep sizing stable.fig.savefig(). Each backend computes text extents (titles, labels, ticks) differently. Always inspect the exported PDF, not just the notebook output.LaTeX + fonts are the usual source of “works on my machine” problems. Docker removes that.
Here’s a Dockerfile that installs common TeX packages and the fonts needed for the preambles above:
FROM python:3.12-slim

ENV DEBIAN_FRONTEND=noninteractive \
  PYTHONUNBUFFERED=1 \

RUN apt-get update && apt-get install -y --no-install-recommends \
  ca-certificates curl git openssh-client \
  fontconfig \
  fonts-linuxlibertine \
  texlive-xetex \
  texlive-latex-base \
  texlive-latex-recommended \
  texlive-latex-extra \
  texlive-fonts-recommended \
  texlive-fonts-extra \
  texlive-science \
  texlive-plain-generic \
  latexmk \
  libfreetype6 \
  libpng16-16 \
  cm-super dvipng dvisvgm ghostscript \
  && rm -rf /var/lib/apt/lists/* \
&& fc-cache -f -vrcParams once, including a venue-specific LaTeX preamble.